Thursday, October 20, 2022

Gathering a sense of community to showcase universities’ research capabilities

A New Zealand university has become a leader in demonstrating its research expertise, equipment and facilities – and it’s building a stronger research community along the way.

In the Māori language, the word “rāpoi” means to “cluster” or to “gather together”. It just so happens that a high-performance computing cluster (HPC) at Te Herenga Waka — Victoria University of Wellington (Te Herenga Waka) is named the Rāpoi HPC, and – perhaps by a happy coincidence – it’s become one of the star attractions of that university’s new showcase of research equipment, capabilities and expertise.

Over the past couple of years, Te Herenga Waka in the nation’s North Island capital of Wellington has been working closely with Symplectic and its own research community to “gather together” what is now among the world’s most impressive – and publicly searchable – collections of resources at any university available for research and consultancy.

Human resources (expertise) and infrastructure resources (equipment, facilities and services) are now all discoverable at the Wellington university’s portal, which is powered by Symplectic: https://people.wgtn.ac.nz/

Te Herenga Waka — Victoria University of Wellington’s Hunter Building.

Sheila Law, Research Information Systems Administrator with Te Herenga Waka’s Research Office, says having earlier built a showcase of the university’s academic expertise through new, searchable staff profiles, the next challenge was to tackle its infrastructure.

“The aim was to create a searchable catalogue of specialist equipment, to showcase our state-of-the-art capabilities, which could be used to support external engagement and facilitate long-lasting collaborations with other researchers,” Sheila says.

But until work began in late 2021, there was no central location or asset register of equipment to refer to. “All the information was held in institutes and schools and centres, with no overview of the resources that we had.”

Kate Byrne, VP Product Management with Symplectic, says: “We’ve found from working with organisations around the world that although many of them have data of this kind, it is very fragmented. And so one of the things we’ve been looking at most is to help some of our clients to start thinking about the early stages of that journey, because it’s very easy to look at our tools and go: isn’t this shiny, it would be great to do that. But actually stepping back and looking at where that data is going to come from, and how you’re going to work with your community to enable it, is part of the challenge,” Kate says.

Wellington’s university was up to the challenge. The small project team worked closely with school managers and technical managers, and with the assistance of internal champions, they gathered all the data needed, arranged for photos to be taken, and identified four categories under which equipment could be clustered: software, instruments, database, and services. 

While the data gathering and entry was painstaking, the result is that Wellington’s university now has a central register with 300 pieces of equipment on show both internally and externally. The portal is notable for its data completeness and quality, and provides images to help demonstrate its equipment and facilities. 

Te Herenga Waka now has a central register with 300 pieces of equipment on show both internally and externally.

Sheila says the university’s staff responded to the finished product straight away. “As soon as we launched it, we started to get interest from areas where they were seeing the potential in it. 

“There was one – the Rāpoi – it’s a sort of computer data hub, which is available for anybody across the university to use. It was great to get that on there. And as soon as that was available, the staff that were using it wanted to link to it from their personal profiles. So that was nice to see – that was our first proof that people are liking this, and now they can see how useful it is, that they can actually show the full capability of their expertise and the resources they have available to them.” 
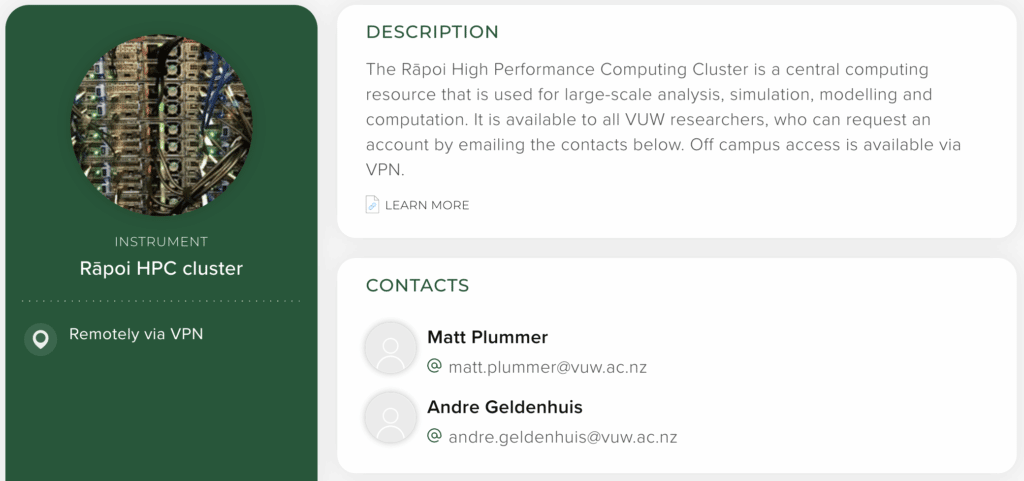
The Rāpoi High Performance Computing Cluster is one of the key attractions of Te Herenga Waka’s new showcase of research equipment, capabilities and expertise.

Since its launch earlier this year, the Wellington university’s equipment website has also gathered interest from staff in New Zealand government departments, who are currently working on a solution for a National Research System. 

Symplectic has been with Te Herenga Waka every step of the way. “How Wellington’s university has approached this challenge and developed such a successful outcome should become a showcase example to other institutions. It’s been a pleasure working with them,” Kate says. 

Sheila Law, Research Information Systems Administrator with Te Herenga Waka’s Research Office.

Sheila says the University’s staff have been critical to the project’s success. “One of our key learnings is how we engage with staff to ensure they become the experts in using the system, and managing the categories and resources that they need to optimise the curation of research activities. 

“By providing ongoing support, we increase the understanding and build confidence in using the system, and we also seek and receive feedback from those users to understand how they’re using the system, and also how they would wish to use it.” 

The concept of “gathering together” – of information and the research community – is ongoing: 

“We continue to look at ways in which we can enhance our profiles further, to create a one-stop ecosystem of interconnected research activities. We continue to explore and test new functionality as it’s made available, to see how we can reduce manual effort, to curate a rich and versatile research ecosystem, to build our reporting capability, and to help researchers expand their research opportunities and find new collaborators.” 

For more information about Symplectic’s Discovery module and Public Profiles: www.symplectic.co.uk/public-profiles

The post Gathering a sense of community to showcase universities’ research capabilities appeared first on Digital Science.


from Digital Science https://ift.tt/6mOeFWc

Tuesday, October 18, 2022

Five measures that chart the rise of Chinese influence in global research

If the story of the 20th Century is one of the decline of the power and influence of the West, then the 21st Century tells the story of the ascent of Asia and more specifically China. Indeed, the era in which we live currently, with the cultural and economic dominance of the West, is something of a historical aberration.

A 2012 report from McKinsey points out that for the better part of the last 2000 years, the centre of economic wealth in the world has been firmly positioned in the East, with a period from the 1500s until 2000 where the centre of mass moved and dwelt (for a while at least) in the West. The enlightenment and the industrial revolution took place first in Europe and our own work shows the movement of the centre of mass of research since the late 1600s to present day – a journey that starts in the UK, moves West to the US, reaching its nearest point in the mid-1940s before moving ever more quickly eastward towards China.

This week’s Communist Party Congress will see it hand leader Xi Jinping an historic third term. If we were to assess China’s growth in non-research terms during his leadership, we might look at its financial output such as GDP at purchasing power parity (PPP), in which case you would notice that China overtook the US to become the world’s largest economy in 2016. In Rachman’s 2016 book Easternisation a framework for thinking about the rise of China is presented. While Rachman looks at the world through the lens of the Thucydides Trap (the Greek-inspired notion that when the pre-eminent nation in the world changes, there must be war between the incoming power and the incumbent) we take a different view in the context of research. Research leads to knowledge that should be the property of all humankind and hence, perhaps naively, we will take the view that the more countries that choose to invest in research, the better it is for all, since, so long as that research is done openly and made openly available, the more innovation and advancement is possible.

In this short blog, we propose a set of research-based measures to track the rise of China.

We propose the following set of metrics by which to rank countries to see how influential they are in the world of research. We have five metrics, in increasing importance and level of difficulty to achieve:

1. Percentage of GDP spent on research: Theoretically easy to achieve for most countries since this is mostly within the hands of the government of the day. It may be a leading indicator of research success but does not take in account the size of the economy, which is obviously a determining factor into how much difference this investment can make.

2. Gold Open Access (OA) publication volume: Slightly harder to achieve than metric 1 since it requires a change in culture and understanding of incentives. This is a stronger leading indicator of the increasing power of a research base.

3. Total publication volume: Highly related to metrics 1 and 2 – to consistently publish a large body of research content in recognised journals requires significant investment in both research infrastructure and capacity. But, also as the current trend is toward OA publication, also a significant investment in Open Access.

4. Proportion of global citations: Still harder, producing high research volume is not the same as producing research that is highly noticed, read and cited. Garnering citations is critical to demonstrate that work is noted.

5. Relative global influence: Using Eigenvector centrality, a network measure that can be considered a proxy for influence in an ecosystem, we calculate this quantity on the co-author graph. Broadly speaking this metric expresses the likelihood that a given paper picked at random from all papers in a given year has an author from a given country on it. It is not a probability but can be thought of as a related quantity.

This is necessarily a reduced list and focuses on highly quantifiable metrics. It does not assess the policy environment in a detailed manner – ease of cross-border travel and ease of access to visas for the purposes of collaboration, study and academic work are obvious ways in which a country can have a disproportionate effect on the research economy. It is also clear that attracting overseas students to study increases diversity at many levels and helps to create networks that can later result in fruitful collaborations – again, this is not something that we’ve considered here.

However, these five metrics are chosen to show causal development. From funding to being able to develop infrastructure and a research population together with the willingness to publish in Gold Open Access journals. This then leads to building a more substantial capacity that is able to produce the consistently high research volumes required for excellent research to be part of the overall mix. While citations are not a proxy for quality, high-quality work is often more noted and hence more cited. Ultimately, if there is funding and serious research worthy of note then this makes a country a destination for collaboration.

1. Percentage of GDP spent on research

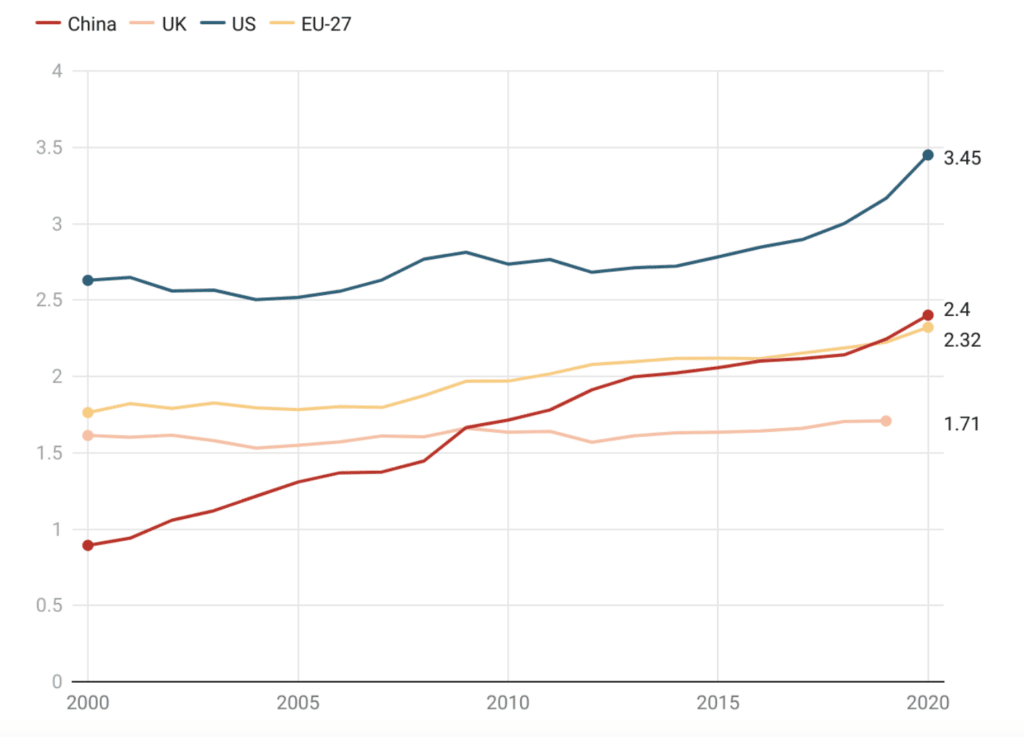
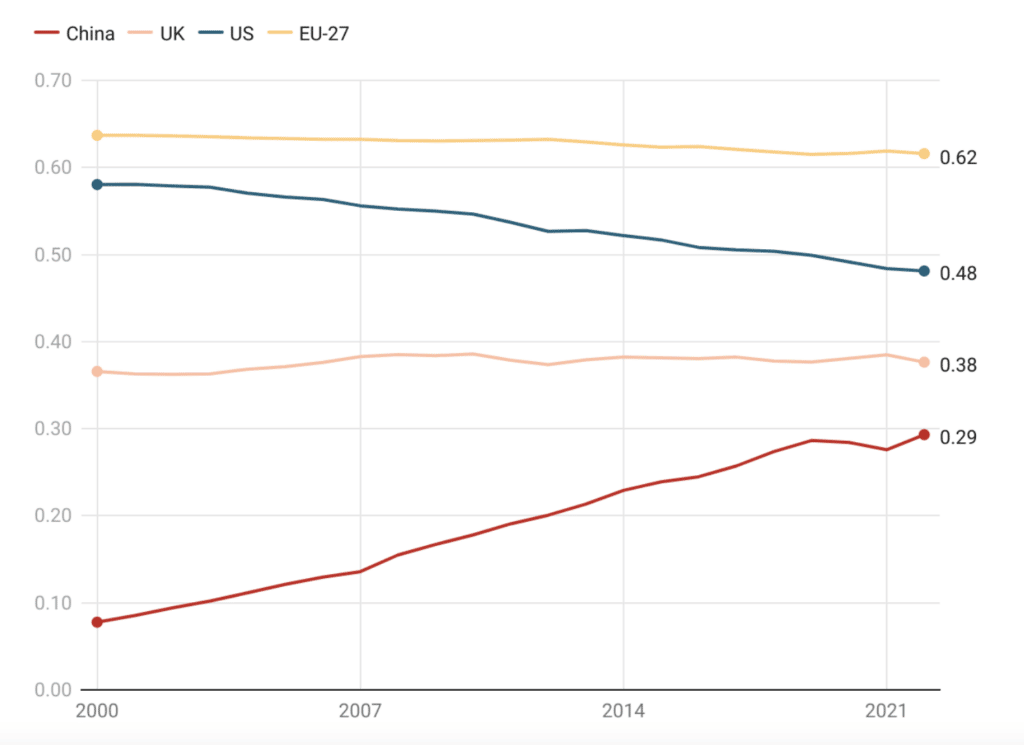
Looking at Figure 1, below, we can see that Chinese investment in Research and Development (R&D) has increased steadily since 2000 to reach 2.4% of GDP in 2020. However, since around 2012 the US has increased its own investment in R&D, a trend mirrored by the EU-27 countries. At the same time GDP at PPP has increased significantly for China. In 2021, China’s GDP at PPP was $27.3tn USD versus $23tn USD for the US, $21.6tn USD for the EU and $3.34tn USD for the UK. This means that the while the US still outspends China in absolute terms, the gap is narrowing between the two countries with China spending around 20% less than the US. If the Chinese and American economies continue to grow at their current rates (3.2% for China versus 1.6% for the US) for a sustained period, China would be spending more than the US on its research base by 2032 without the need to increase the percentage of GDP invested. Of course, China may see a slowdown given the current financial picture, but it has also been clear that the country is keen to invest in research and hence it may well be that China chooses to increase the percentage of GDP that it wishes to commit to its rapidly increasing research economy.

Figure 1: Percentage of GDP spent on research by country between 2000 and 2020. Source: World Bank.

2. Gold Open Access publication volume

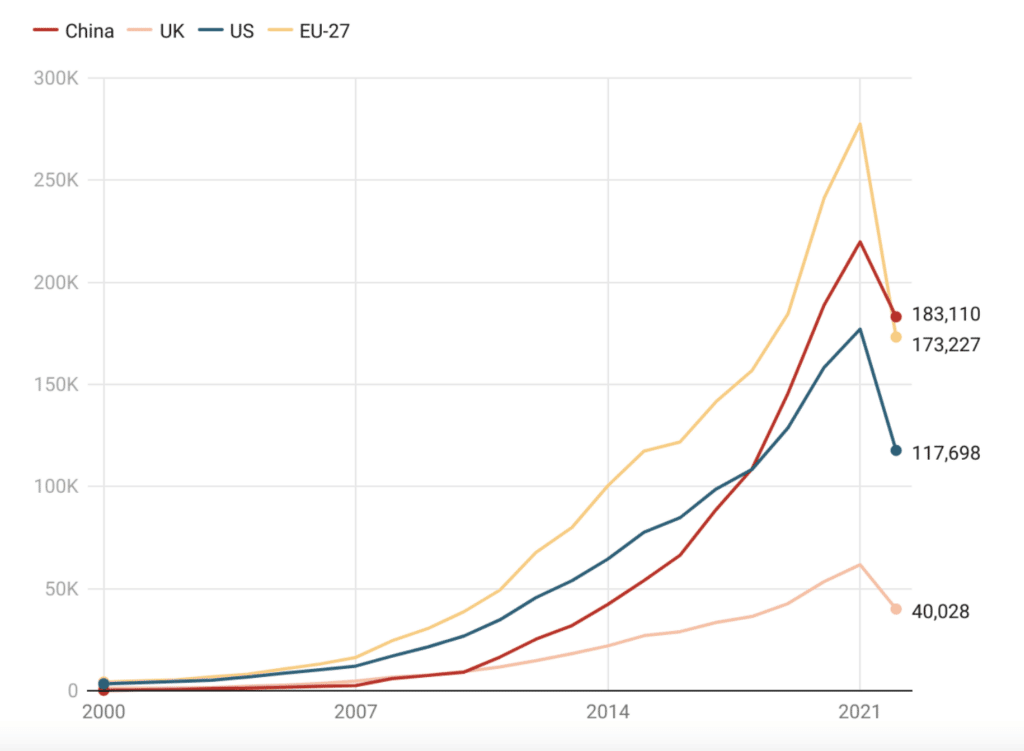
Advanced research economies have typically invested heavily in open models of publishing and sharing research in the last decade. The reason that we have focused on Gold rather the Green OA here is that Gold OA conflates two political components – firstly, the willingness to adopt policies to make research broadly openly available and, secondly, the ability to fund OA. Green OA, which is frequently considered a more progressive form of OA is often more difficult to track since funding for it is usually done through infrastructure, which is harder to track than Gold OA author processing charges. The UK has been a leader in Gold OA alongside countries such as Australia, Brazil and India. However, if we look at the main “blocs” – China, the EU and the US we see that the EU (see Figure 2) has historically been the most committed to supporting Gold Open Access, as can be seen in its overall volume. In 2009, China only equalled the UK in Gold OA volumes, but there is a clear inflection around that point, when China accelerated, overtaking the US around 2017, and looking to be on course for overtaking the EU this year (based on an extrapolation of partial year data).

Figure 2: Volume of Gold Open Access publications (article and conference proceedings) by country between 2000 and 2022 (partial year). Source: Dimensions from Digital Science.

3. Total publication volume

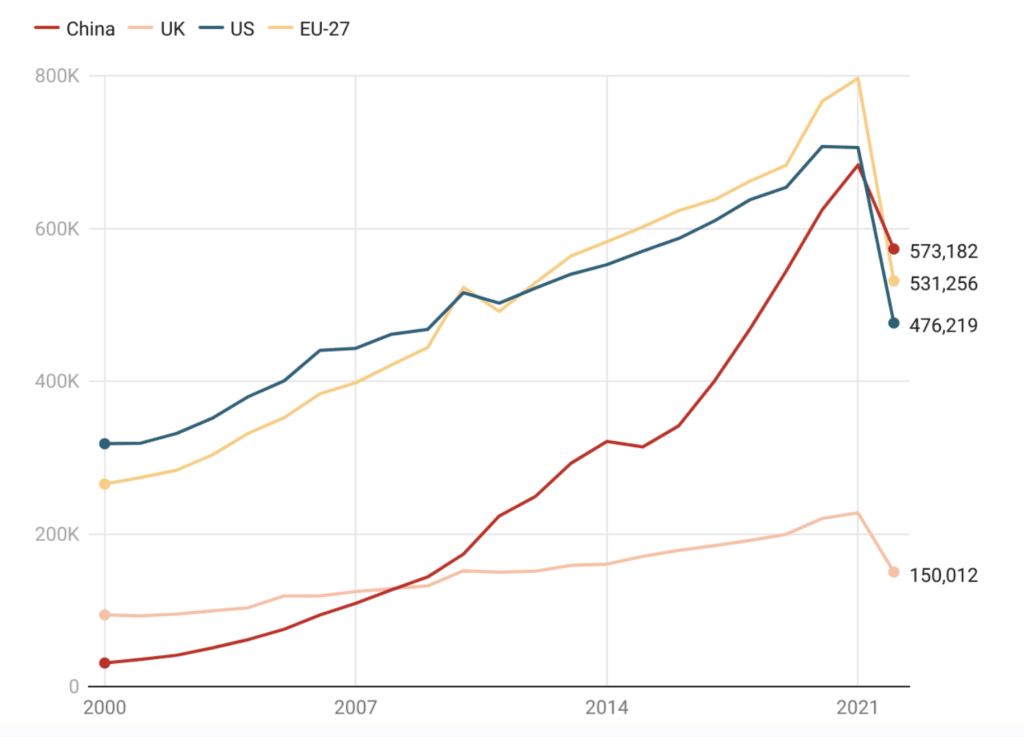
Another obvious marker of research development is the total volume of publications. This is harder to achieve than the previous two markers as a sustained high-level of production requires long-term development of infrastructures to support research, as well as feeder mechanisms such as training for undergraduates, PhD students and postdocs. It generally also requires a vibrant research community and opportunities to collaborate internationally (which is discussed further on). In Figure 3, we see that not only will China surpass the US this year but it also looks likely to leapfrog the EU in production volume.

Figure 3: Total volume of publications (article and conference proceedings) by country between 2000 and 2022 (partial year). Source: Dimensions from Digital Science.

4. Proportion of global citations

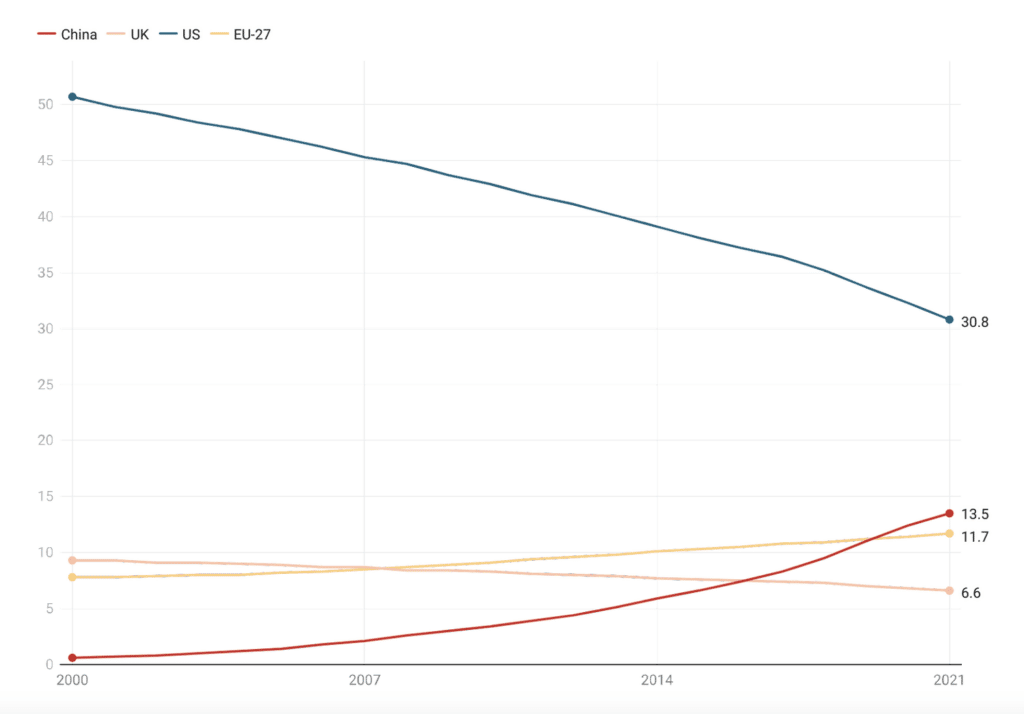
To be considered the preeminent research country, it is not merely about research volume but whether research is noteworthy enough to be cited. Since 2000, the research world has diversified significantly on the global stage with many countries beginning to play an active role in developing their research economies. As a result of this development the overall share of global citations garnered by established actors such as the US and UK has naturally decreased. The EU (as the old eastern bloc countries began to more seriously invest and develop) has grown its share. But, the big winner has been China, moving from a tiny single-digit share of global citations in 2000 to 13.5%, a level that is almost a full 2 percentage points ahead of the EU-27. While this is still dwarfed by the almost 31% attracted by the US, it is clear that China is producing a high level of very noteworthy research.

Figure 4: Proportion of global citations (as a percentage of overall global citation) by country between 2000 and 2022 (partial year). Source: Dimensions from Digital Science.

5. Relative global influence

Finally, we use a network measure called Eigenvector Centrality on the co-authorship graph to work out who the preferred partners are to work with by country (Figure 5). The EU-27 countries have continued to be the favoured research partner over the last two decades.This metric is heavily influenced not only by the large volume of papers produced by the EU-27 countries but also their strong links with other collaborators such as the US, UK, China and beyond. Of course, each individual country in the EU-27 will look significantly weaker on its own, however, there is significant power to be gained from being part of the bloc, as can be seen from the network effect highlighted here. Thus, coordinated funding streams such as Horizon 2020 have built an excellent platform for the research influence of the EU-27.

Figure 5: Eigenvector centrality “influence” of countries based on the global co-authorship graph between 2000 and 2022 (partial year). Source: Dimensions from Digital Science.

The relatively smaller size of the US together with its stronger internal collaboration network places it second in the list. The UK outperforms on this measure due to a number of historical advantages – its strong global connections through the Commonwealth; its past relationship and general geographic proximity to the EU-27; its historically strong relationship with the US; and the establishment of English as the global language of research. These factors all mean that the UK is something of a destination for students, who then either stay and create connections to their home countries or return to their home countries and continue to collaborate with their UK-based colleagues.

China, by comparison, has not yet had time to build a large and complex network of global collaborations. At the same time, it is growing its research capacity so rapidly that few countries have the absorptive capacity to work with China at the scale that is possible. That tends to imply that China’s research collaborations are currently more internally focused than might otherwise be the case where they too have developed to their current size more slowly. However, it is still clear that China is quickly developing into a highly collaborative global partner with scale.

This trend will be highly relevant for the scholarly communications industry. As the great and the good of academic publishing descend on Germany this week for the Frankfurt Book Fair, they are acutely aware of the rapid increase of Chinese research, and strategically one of their main challenges is how to attract authors to their books and journals and increase their market share of content. Given recent policy changes in China, traditional citation measures as represented by metric 4 and modern vectors such as metric 5 could combine to inform publishing strategies around, for example, how to encourage and facilitate global collaboration with Chinese authors. 

Closing thoughts

Each one of the five measures gets successively harder to achieve pre-eminence and, in some sense, one leads to the next. A country can decide to spend a large amount of its GDP on research if it values research and believes in the long-term effects of that for its people.  Of course, there are two aspects to this – government spending and industry spending. A government can encourage industry spending on research with the local tax environment and other inducements but, at the end of the day, this is also a cultural phenomenon.  Those who believe in the value of research will generally invest. As a country becomes richer and levels of education increase, it is a choice often made to invest in research for future prosperity and for the long-term benefit of its people. Increasingly the richest companies appear to see things similarly.

Once a research economy is established, there is a clear value in sharing results through open access to increase the volume of material available upon which to build, which leads to metric 2. Of course, if a country is wealthy then paying for open access is also something that is within reach.  But, more generally, it is important to have sufficient research volume that you can ensure that a proportion of that research is of high quality – an effect that only tends to happen at a certain scale of endeavour and hence metric 3 becomes important. As metric 3 is achieved, then the international community should begin to recognise the value of the research being produced and it should become more cited, leading to metric 4 and finally, in achieving high quality research at scale, the country becomes a destination for collaboration and gains influence in the global social research network, which is metric 5.

Thus far, China has established itself sufficiently in metric 1 that it has been able to achieve pre-eminence in metrics 2 and 3. (This development may be surprising to some as it was not obvious that China would overtake both the US and the EU-27 in the same year in metric 3!)  Metric 4 tells a broader picture – that citation patterns are diversifying.  It is not merely that the proportion of citations to the US is dropping and switching to China, but rather that the proportion of citations to the US is dropping in favour of greater geodiversity, of which China is one recipient.  South America, and Asia in general are developing significant research economies, which is a positive trend.  Finally, China’s development in metric 5 is impressive.

Within just a few years China’s global influence has developed to a point where it is clear that, if it continues on its current path, within a decade it will be vying with the EU-27 for global pre-eminence in its ability to influence the global research conversation.

About Dimensions

Part of Digital Science, Dimensions is a modern, innovative, linked research data infrastructure and tool, re-imagining discovery and access to research: grants, publications, citations, clinical trials, patents and policy documents in one place. www.dimensions.ai 

About the Authors

Daniel Hook
Daniel Hook

Daniel Hook, CEO | Digital Science

Daniel Hook is CEO of Digital Science, co-founder of Symplectic, a research information management provider, and of the Research on Research Institute (RoRI). A theoretical physicist by training, he continues to do research in his spare time, with visiting positions at Imperial College London and Washington University in St Louis.

portrait of co-author Simon Porter
Simon Porter

Simon Porter, Director Innovation | Digital Science

Simon Porter has forged a career transforming university practices in how data about research is used, both from administrative and eResearch perspectives. As well as making key contributions to research information visualization, he is well known for his advocacy of Research Profiling Systems and their capability to create new opportunities for researchers.

The post Five measures that chart the rise of Chinese influence in global research appeared first on Digital Science.


from Digital Science https://ift.tt/BzisPxG

Thursday, September 29, 2022

Research in the second Elizabethan era: A platinum age for the Commonwealth and the UK

From physical empires of the past to information and virtual empires in the modern era, the last 70 years have borne witness to astonishing change in both research and science and how they are communicated. But where have these shifts occurred, and what do they tell us about the future? And what will be the legacy of Elizabeth II’s long-lasting reign for science and technology?

In the UK, Commonwealth countries, and around the world, people have mourned the passing of Queen Elizabeth II. For many, she will be remembered as a dedicated public servant who gave her support to charities and good causes, raising their profile and giving them a voice that helped them to be noticed in the world. For a good deal more than half a century, successive Prime Ministers have regarded her as a giver of context and a provider of a safe space to air concerns and discuss the challenges of the day that they could share with no one else. She has been widely recognised as a constant in our lives and, by some, as the embodiment of all things British in a changing age. An instantly recognisable figure, the Queen has played the role of an observer of that change, unable to be actively involved in politics but having privileged access to politicians, celebrities and changemakers globally during a period of great change.

Billboard in Piccadilly Circus displaying a tribute to Queen Elizabeth II.
Billboard in London’s Piccadilly Circus displaying a tribute to Queen Elizabeth II.
Image credit: Ocean Outdoor.

In this brief commemoration in honour of Her Majesty, we wanted to reflect on the changes in research and, in particular, in scientific research that have characterised the modern Elizabethan era. The Queen was crowned in the same year that Watson and Crick (with the significant help of Franklin) published their paper on the double helix structure of DNA in 1953. Over the intervening 70 years, the UK has not only remained at the forefront of research, but has made contributions that have been key to shaping the emerging exponential industrial revolution. From Sir Tim Berner-Lee’s pioneering work around the World Wide Web in the late 1980s, to the London-based DeepMind team who solved the protein-folding problem with AlphaFold, the UK has been the home to some of the greatest scientific advances of the late 20th and early 21st Centuries.

Like her great-great-grandmother Queen Victoria, Queen Elizabeth married a man who had great interest in, and who consequently was a great supporter of, science and technology. The Victorian era is one that is remembered not only for empire but also for innovation and its technological contribution to the world, and we suggest that the second Elizabethan era will be viewed similarly in this respect. In 1952, the UK produced around 2% of the world’s research output and the broader Commonwealth of Nations, with which the Queen is so intimately related, around 3%. As of 2021, the UK produces around 4% global research and, together with other Commonwealth countries, around 14%.

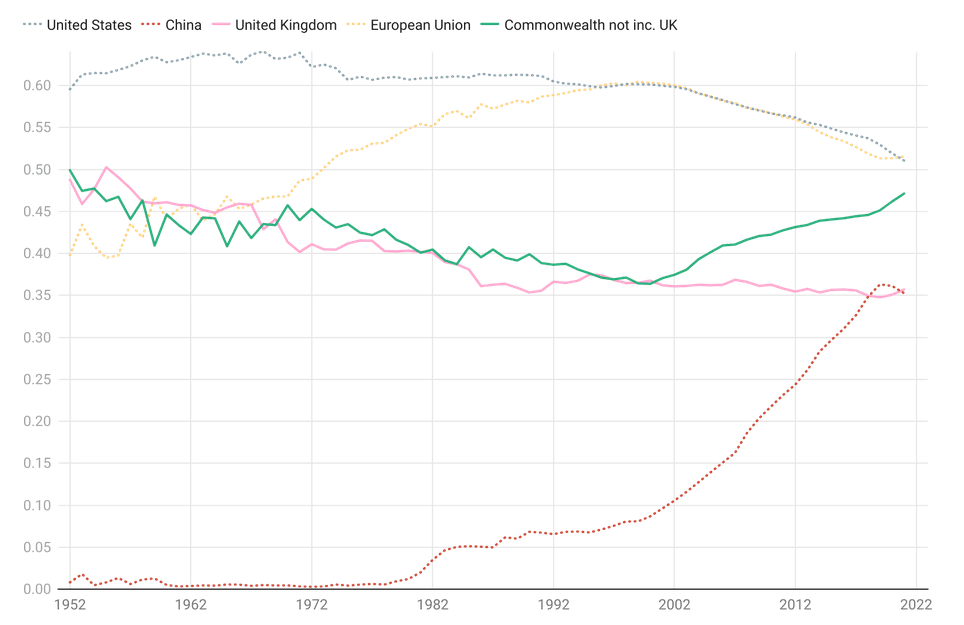
The influence of the Commonwealth on the world stage often goes unseen but network effects are powerful in today’s world.  Figure 1 shows relative global influence on research of each country or set of countries using a technique that we’ve developed at Digital Science over the last few years based on the eigenvector centrality network measure. The core of the idea is that research volume and research citations only show a superficial picture of research strength. Research is becoming an increasingly collaborative pursuit and success is born of finding the right people with which to work. Eigenvector centrality calculated in the way shown here mixes volume, citation and level of collaboration into one metric that, we argue, is an interesting proxy for influence. In the figure you can see that since 1952 the global influence of the US was strong in the 1950s and 1960s, but decreased in the 1970s and 1980s, stepping down once again in the 1990s and has gradually waned since the turn of the millennium.  On the other hand, China, which had little global research influence at all until the 1980s has grown significantly in the last three decades, overtaking the UK in the last few years.  

However, what is striking about Figure 1 is that the Commonwealth has not only established a solid foundation of global research influence (doubtless due to its large “surface area”, with 56 countries collaborating globally), but that it has also begun growing significantly in its influence in the last 20 years. Of course, when the Queen originally became the Head of the Commonwealth, there were just 8 member states and hence their influence would have been even less than shown in the diagrams here. Our analysis follows the influence of the full current 56 member states throughout the life of the Queen’s reign. While the influence of this group may be unsurprising as it counts highly developed research economies such as Australia, Canada and New Zealand amongst its number, it should also be recognised that it is a disparate collection of countries that includes small and developing economies as well as large ones.

The spread of internet technologies (as mentioned above, an innovation that owes an important part of its lineage to the UK) has enabled smaller nations to play on the international stage of research – a distinct advantage for some Commonwealth-member countries who share a common set of values, language, and a legal system, that all facilitate collaboration. In the age of the internet, distance is no longer a barrier to these countries working together on research projects Hence, while the UK (separate from the Commonwealth) has generally waned in its international research influence, it is notable that it has been less susceptible than others such as the US and the EU to decline in influence.  We suggest that this is likely to be due to its strong ties with Commonwealth nations.

Eigenvector centrality.
Figure 1: Eigenvector centrality for US, China, UK, EU and the Commonwealth (not including the UK) from 1952 to 2021. The graph for each country or country grouping shows the influence of the research outputs of that country based on its co-authorship network. (Source: Dimensions.)

Over the modern Elizabethan era, the world has moved from an age of physical empires through the space race and the computer revolution to an age of information and virtual empires. From a political perspective, the UK relinquished its role as global power and instead needed to content itself with the role of influencer on the world stage. In an elegant parallel, the monarchy moved from being a “great Imperial family” to influencers both culturally and politically. The Queen’s personal style transcended the geopolitical zeitgeist as she lent her personal brand to long-term projects such as the Commonwealth.

By all accounts the Queen believed in the Commonwealth as a group of nations who could make positive change and she fought for that. In the case of research, as the US and EU gradually wane in their influence, it may well be that the Commonwealth has the collaborative spirit, as well as the geographical and cultural diversity to continue to influence the world positively. If true, this would be a worthy legacy for someone whose life was one of service.

About Dimensions

Part of Digital Science, Dimensions is a modern, innovative, linked research data infrastructure and tool, re-imagining discovery and access to research: grants, publications, citations, clinical trials, patents and policy documents in one place. www.dimensions.ai 

About the Authors

Daniel Hook
Daniel Hook
Simon Porter
Simon Porter

Daniel Hook, CEO | Digital Science

Daniel Hook is CEO of Digital Science, co-founder of Symplectic, a research information management provider, and of the Research on Research Institute (RoRI). A theoretical physicist by training, he continues to do research in his spare time, with visiting positions at Imperial College London and Washington University in St Louis.

Simon Porter, Director Innovation | Digital Science

Simon Porter has forged a career transforming university practices in how data about research is used, both from administrative and eResearch perspectives. As well as making key contributions to research information visualization, he is well known for his advocacy of Research Profiling Systems and their capability to create new opportunities for researchers.

The post Research in the second Elizabethan era: A platinum age for the Commonwealth and the UK appeared first on Digital Science.


from Digital Science https://ift.tt/bLcU7av

Thursday, September 1, 2022

Inside Story: How a postgrad plagiarised at least 60 papers in huge publishing scam

To fall down a rabbit hole, in today’s usage, implies that while done voluntarily, the consequences are nightmarish, with all sorts of hazards and unintended consequences. While this differs to the original meaning from Lewis Carroll’s Alice’s Adventures in Wonderland, as this New Yorker article spells out, there are corollaries that have only been discovered in today’s online-dependent world.

So, when Ripeta co-founder and CEO Leslie McIntosh described the start of her investigation of suspicious publication activity in March 2022 as being “interested in going down this rabbit hole”, she knew that while it would satisfy her curiosity as someone who had built a company on the basis of trying to improve science, it could also lead to some painful realisations as to how research and publications can go awry.

Back Story

The rabbit hole first appeared – as they so often do – in the shape of a tweet where an author had bemoaned the fact that a journal was ignoring the entreaties to act on a paper that had evidently plagiarised their own work. Over a year later, nothing had been done and so the author had taken to social media to air their concerns. After looking into the alleged plagiarism, Dr McIntosh found that the author in question – Mohammed Sabah Uddin – had published well over 100 papers while at Southeast University in Bangladesh before moving on more recently to Hong Kong University. Dr McIntosh’s suspicions were further raised by an acknowledgement in the suspect article from ‘Pharmakon Neuroscience’, which could not be verified in the GRID database maintained by parent company Digital Science

After completing a series of integrity checks using Ripeta’s technology, including cross-referencing co-authors and funding agencies, Dr McIntosh found a number of other similar acknowledgments of Pharmakon by using the Dimensions database, which contains full text searching suitable to support this type of forensic work.

Dr McIntosh explains: “The work myself and colleagues carry out is a way of protecting the academic record, and in so doing supports the increasing number of institutions, publishers, funders, and researchers who place research integrity at the heart of their approach to research.”

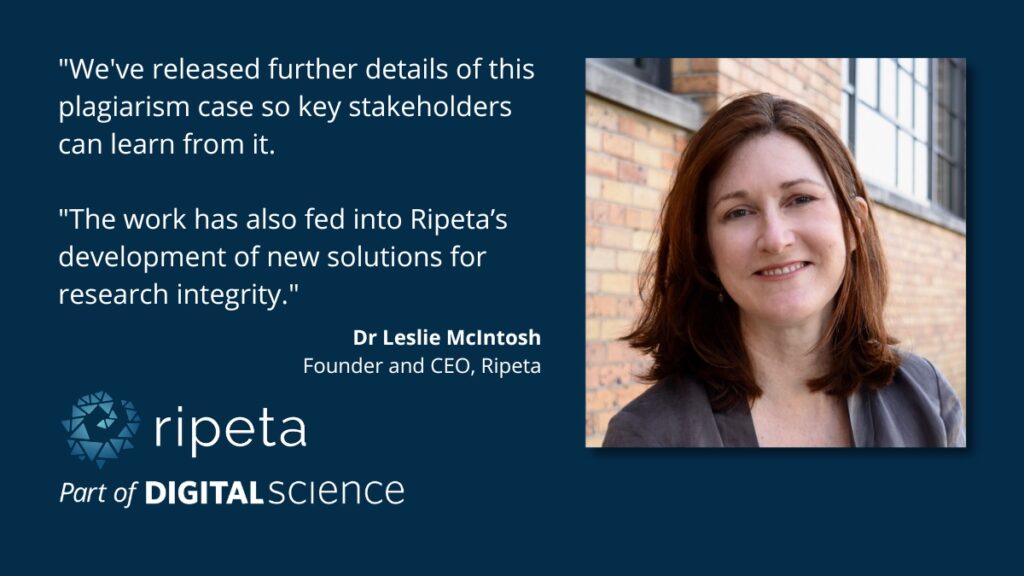
“As part of Ripeta’s work providing tools to highlight potential challenges to research and publication integrity principles, we will build a case study so key stakeholders can learn from this example. The work has also fed into Ripeta’s development of new solutions for research integrity.”

Analyses revealed other anomalies in Uddin’s publication record, such as:

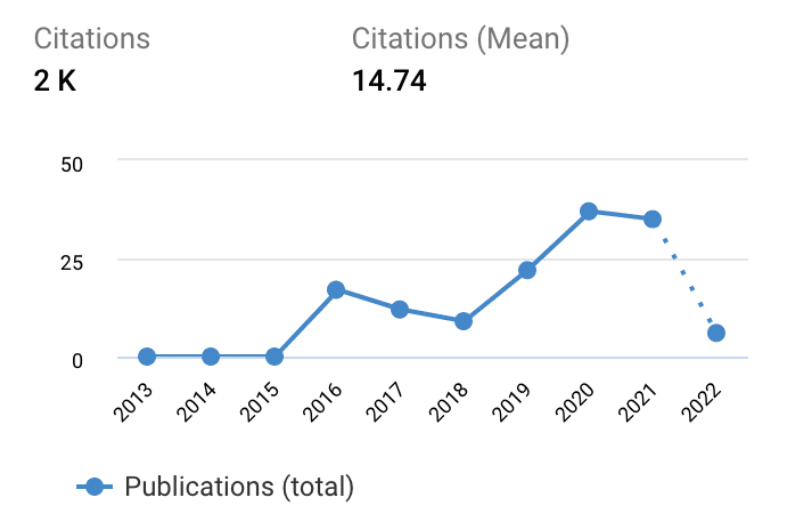
  • A large number of articles published (130+) in a short time (from 2016-2021; source: Dimensions)
  • A high number of citations to those papers (2,000+)
  • A high number of verified reviews on Publons (300+).

Further details on Uddin’s publication record can be seen in the Appendix below.

These and other ‘trust markers’ led Dr McIntosh to consult Digital Science colleague Simon Linacre, who in addition to having 20 years’ experience in academic publishing, is also a Trustee of COPE with expertise in deceptive publishing practices. Confirming the findings of the investigation, it was time to approach the author himself.

“The work myself and colleagues carry out is a way of protecting the academic record, and in so doing supports the increasing number of institutions, publishers, funders, and researchers who place research integrity at the heart of their approach to research.”

Dr Leslie McIntosh, Founder and CEO, Ripeta

No Reply

In May 2022, Linacre used several verified email addresses to contact Uddin with a number of questions about the high volume of his articles and their similarities to other papers. Uddin was contacted three times to no avail, which is common when dealing with suspicious actors in the publishing environment. It was then decided to contact his current employer, which not only sparked an immediate response from HKU but also from Uddin himself, all on the same day. Apologising for not replying because earlier emails had gone into his email junk folder, scant details were supplied to the initial queries that had been raised. Further queries were sent to Uddin, this time copying in HKU, before the university announced a formal investigation.

The university acted quickly. After little more than a month following its investigation, HKU found evidence of improprieties on behalf of Uddin. It said he had admitted to copying 60 published papers out of a total of 180 published in the last few years – industrial-scale plagiarism made possible by using paraphrasing software to escape detection by anti-plagiarism tools. At this stage, it is still unclear how the other papers were written and published so quickly and which exact papers he authored legitimately. Overall, 90% of all articles published by Uddin are indexed in PubMed across more than 100 different journals and 10 different publishers. 

Soon after concerns were raised with HKU, Uddin’s publication history in his ORCiD profile significantly changed from populated to empty. All citations and references were deleted. In late June, HKU signalled their investigations had concluded. HKU informed Digital Science Uddin would withdraw from his PhD program at the university, effective on 1st August.

Speaking on behalf of HKU, Professor Danny Chan, Director (Education and Development of Research Integrity) said: “Upholding research integrity has always been, and will continue to be, our top priority. Any breach of trust is not only detrimental to our career, but also to the funders and the academic world. We strive to ensure our students and colleagues are putting this commitment in daily practice.“ 

Looking Ahead

Since the story was published in Retraction Watch on 25 August, a number of enquiries have been made about other aspects of the case. Who was the author in question? Why did they plagiarise so many articles? Could more have been done to identify what was going on earlier?

As Dr McIntosh commented on the Retraction Watch article when someone asked about Uddin’s acceptance into a PhD program at HKU: “This means the university must have access to both a database with all the publications and a means to disambiguate the author’s name. If anything, it shows the cracks in our current ecosystem and that HKU is willing to improve.”

To ponder too much on the motivations of an individual author can risk overlooking the systemic issues in play that can drive researchers into going to extreme lengths to develop a stacked CV. The proverbial ‘publish or perish’ culture still persists in many research environments, and it is unlikely Uddin is the first to use new tools such as paraphrasing software to pad out their publishing record. The good news is that in addition to Ripeta’s existing solutions, it is developing new tools and integrations that have been aided by the Uddin investigation which should help institutions and publishers head off such problems in the future. The bad news is, however, that as part of the investigations into Uddin, they necessitated several other ‘rabbit holes’ in the shape of co-authors and other articles acknowledging Pharmakon support. There is still a long way to go before Alice hits the bottom of this particular rabbit hole, and it is unlikely to end up anywhere like Wonderland.

Appendix

Md. Sahab Uddin Publications per Dimensions (by citations)

Md. Sahab Uddin’s Publications Citations per Dimensions*

Publication Year

2017

2016

2018

2019

2020

2021

2022

GRAND TOTAL

Unique DOIs

17

12

9

21

35

34

6

134

Sum of Times Cited

181

101

176

837

571

132

1

1999

* This is the number of publications Ripeta identified with just the author’s name and the number of citations to papers during that year.

Simon Linacre

About the Author

Simon Linacre, Head of Content, Brand & Press | Digital Science

Simon has worked in scholarly publishing for almost 20 years. His background is in journalism, and he has been published in academic journals on the topics of bibliometrics, publication ethics and research impact.

The post Inside Story: How a postgrad plagiarised at least 60 papers in huge publishing scam appeared first on Digital Science.


from Digital Science https://ift.tt/xXfTAnu

Thursday, August 25, 2022

Taking Open Access book usage from reports to operational strategy

Understanding how many times an open access (OA) book has been viewed or downloaded is only part of the story – what you then do with the data is when the tale really unfolds…

Note: This blog post includes excerpts from the OA eBook Usage Data Analytics and Reporting Use-cases by Stakeholder report by Drummond and Hawkins.

While the term “usage data” most often refers to webpage views and downloads associated with a given book or book chapter, scholarly communications stakeholders have identified a near future where linked open access (OA) scholarship usage data analytics could directly inform publishing, discovery, and collections development in addition to impact reporting. 

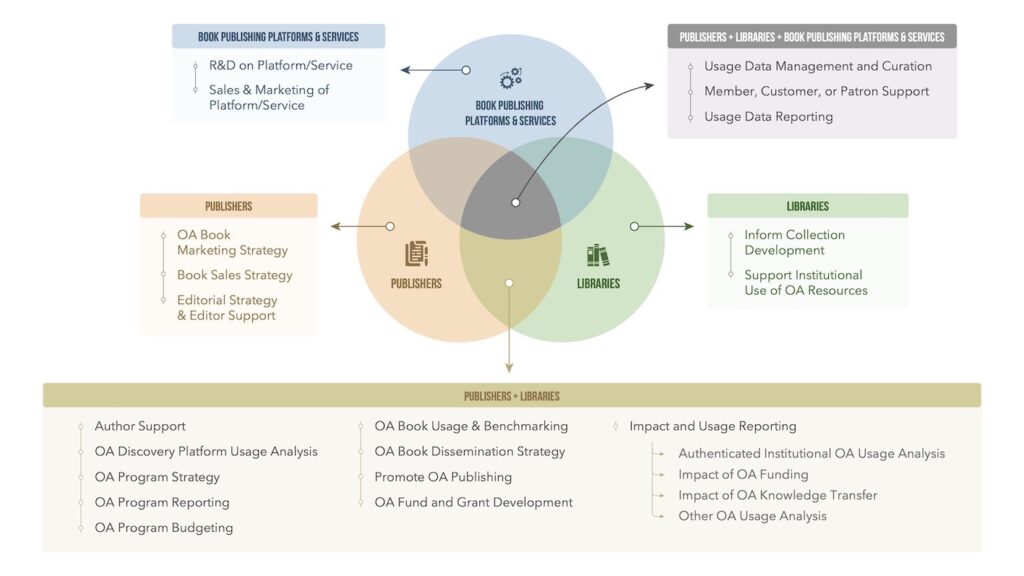
In the 2020-2022 Exploring Open Access Ebook Usage research project supported by the Mellon Foundation, publisher and library representatives expressed their interests in using OA eBook Usage (OAeBU) data analytics to inform overall OA program investment, strategy and fundraising. A report summarizing a year of virtual focus groups noted multiple operational use cases for OA book usage analytics, spanning book marketing, sales, and editorial strategy; collections development and hosting; institutional OA program strategy, reporting, and investment; and OA impact reporting for institutions and authors to support reporting to their funding agencies, donors, and policy-makers.

Figure 1: OA Book Usage Data Use Cases for Publishers, Libraries, and Book Publishing Platforms and Services. Excerpted from Drummond, Christina, & Hawkins, Kevin. (2022). OA eBook Usage Data Analytics and Reporting Use-cases by Stakeholder. Pg 2. Zenodo. https://doi.org/10.5281/zenodo.7017047

“In order to realize the full benefits of OA data usage we must create an ecosystem that operates according to open data sharing, security, and use principles.”

Christina Drummond, OA Book Usage Data Trust

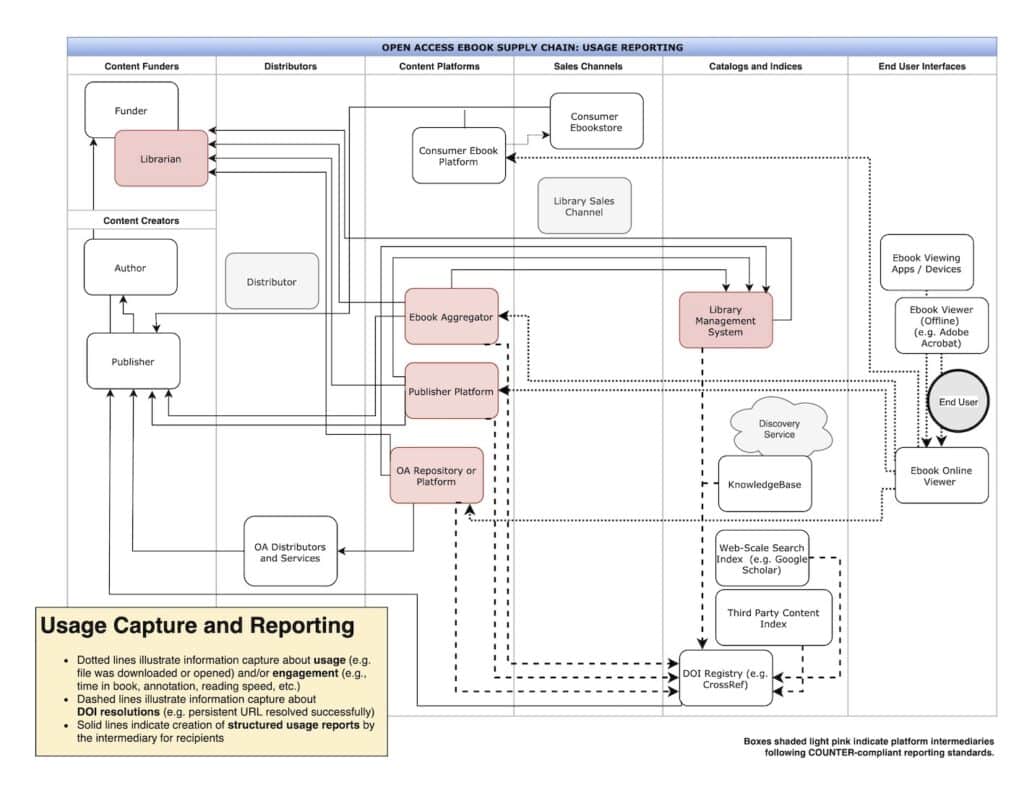
Evidence-based decision-making depends on comprehensive, quality data. The tale of an OA book or author’s impact depends upon marrying usage data created by a plethora of publisher platforms, digital libraries, and OA repositories with linked citation information from scholarship, syllabi, gray literature and policy proceedings. As Laura Ricci and Michael Clarke elegantly documented, OA book usage data is created at multiple points across the book supply chain, to be ultimately curated and collated by each library, publisher, and library management system working with OA titles.

Figure 2: Open Access EBook Supply Chain: Usage Data Capture and Reporting Data Flows. Excerpted from Clarke, Michael, & Ricci, Laura. (2021). Open Access eBook Supply Chain Maps for Distribution and Usage Reporting. Zenodo. https://doi.org/10.5281/zenodo.4681871

The work required to produce cross-platform, contextual usage-related OA reports and analytics is significant. Such data aggregation and reporting requires the processing and curation of numerous COUNTER-compliant and non-compliant reports, APIs, dashboards, and spreadsheets.This resource-intensive exercise requires specialized expertise to understand which metrics can (and cannot) be combined while annotating bot traffic, avoiding data quality issues, and reporting on publicly available data alongside information that’s accessible per data-use agreements. While larger operations have access to such expertise, smaller presses, publishers, and start-ups risk being unable to do so, thereby missing out on derived strategic insights.  

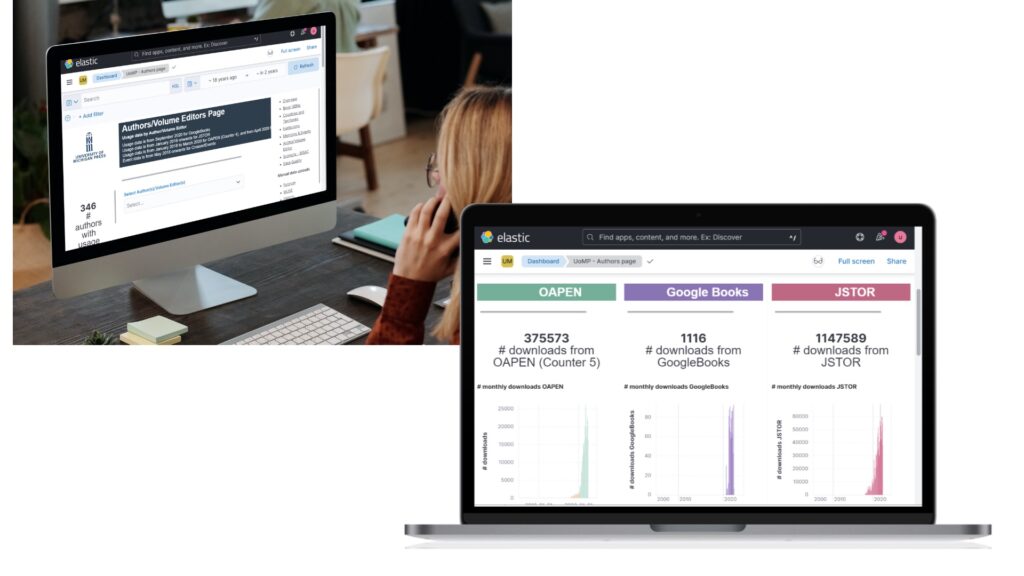
OAeBU data can inform service relationships as publishers and libraries seek to understand online book distribution niches or evaluate book hosting and dissemination offerings. Similarly, publishing platforms and services can leverage usage data to improve and target their own offerings for the scholarly communications community. Yet context is key. As illustrated through pilot OA monograph usage data dashboards developed by the Curtin Open Knowledge Initiative, innovation is occurring around usage data dashboards and analytics services to meet the specialized needs of publishers, libraries, funding agencies, and scholars.

University of Michigan Press OA Book Usage Data Dashboard (https://ebc.press.umich.edu/impact/#oa-book-usage): Graphics reflect screen captures of the Authors Page Prototype.

To fully analyze the impacts of Open Access on society, scholarly communications stakeholders must improve OAEBU data quality, processing, and reliability. Federated national or regional data infrastructure efforts already suggest ways to facilitate data processing and exchange across public and private organizations big and small. The US-based National COVID Cohort Collaborative is simplifying the controlled, ethical data sharing, aggregation, and use of COVID trial data across public and commercial research labs. European industry-based collaboratives are applying International Data Space (IDS) standards and certifications to facilitate public and private data exchange for mobility, logistics, and healthcare. Supported by the Mellon Foundation, a team led by PIs at the University of North Texas, OPERAS, OpenAIRE, and Johns Hopkins University is working to build upon past efforts to: a) host community consultations to create a multilateral data-processing and stewardship rule book for OA book usage data, b) quantify data trust participation benefits for book publishing stakeholders, and c) understand the full operational costs related to an international data space for OA book usage. If successful, this OA Book Usage Data Trust effort could make usage data management and reporting less costly and more accessible for all open monograph stakeholders.

While the use of data space infrastructure will drive economies of scale – and therefore cost savings – for book publishing stakeholders, in order to realize the full benefits of OA data usage we must create an ecosystem that operates according to open data sharing, security, and use principles. By fostering trusted, responsible, direct data exchange, our researchers, publishers, libraries, funders and the wider community will all stand to gain.

Christina Drummond

About the Author

Christina Drummond, Executive Director | OA Book Usage Data Trust

For over 20 years, Christina has worked at the intersection of data analytics, strategy, and policy. As the Executive Director for the OA eBook Usage Data Trust effort, Christina is helping to improve the quality, completeness, and timeliness of OA impact data while reducing reporting costs through better global usage data exchange, aggregation and governance.

The post Taking Open Access book usage from reports to operational strategy appeared first on Digital Science.


from Digital Science https://ift.tt/R73i4KS

Wednesday, July 27, 2022

How can central research facilities expand their role in the science community?

Governments and research consortia can reap great benefits for the community and industry through large, shared research facilities and infrastructure.

What happens when experiments are too big and too expensive for a single university to run?

Some research efforts need to be conducted at a huge scale, drawing on multiple partner institutions; it’s not always feasible or advisable for one institution to be the sole focus of that work. Instead, large scientific instruments and experimental infrastructure are built and maintained at central facilities.

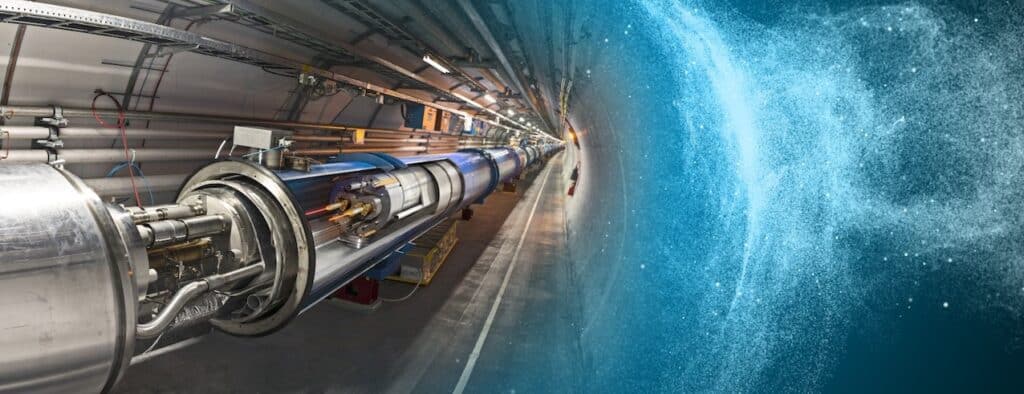
These advanced research tools range from underground labs at the bottom of mines, to free-electron lasers and particle accelerators – such as the Large Hadron Collider at CERN, Switzerland.

The Large Hadron Collider (LHC) is the world’s largest particle accelerator. It’s a prime example of a facility that fosters international scientific collaboration. Photograph: Dominguez, Daniel; Brice, Maximilien. Credit: CERN.

Due to their scale and cost, these facilities tend to be built and managed by government agencies or public research funders and made available to the national or international research communities. Such research facilities represent a major, long-term investment in a region’s research and innovation capability – from initial conception, to designing, building, maintaining, and upgrading facilities and their equipment, the commitment required from governments and their agencies can span decades of public expenditure.

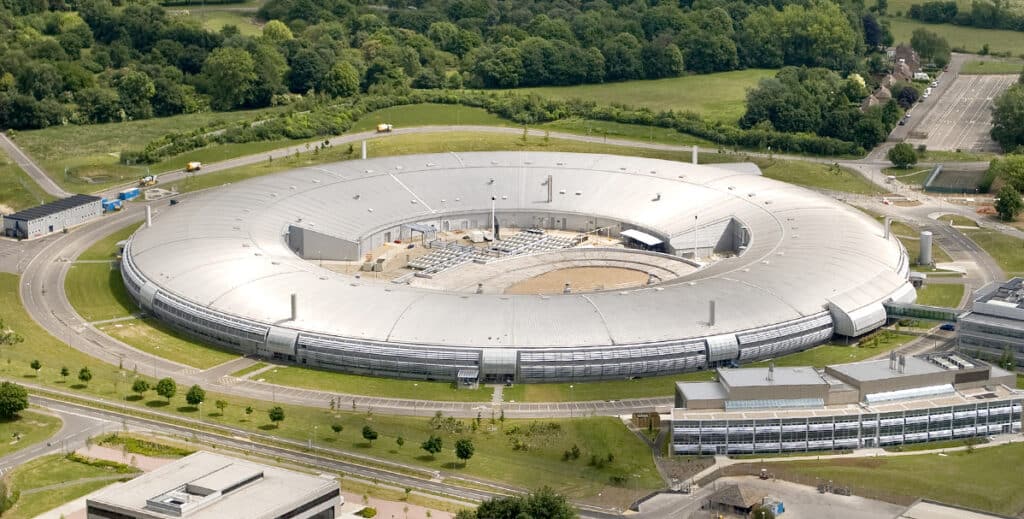
For example, by the time Diamond – the UK’s national synchrotron light source – started accelerating electrons, it was one of the British Government’s largest capital expenditures on research and development in 40 years, costing £260 million (more than US $300 million in today’s currency). From the time of the initial report in the 1990s recommending its construction to the date of its first user beam in 2007, the synchrotron had taken 14 years to come to fruition.

Diamond Light Source is the United Kingdom’s national synchrotron. It was the largest science facility to be built in the UK for 40 years.

Why do governments and funders invest so much in central research facilities?

The discoveries made at central facilities would be impossible elsewhere. Experiments at such facilities employ highly specialised technical equipment and foster collaboration between leading experts, attracting national and international scientific talent. This combination of technical excellence with scientific expertise leads to novel results, the creation of new knowledge and innovation, and pushes the frontiers of many research fields. From an academic standpoint, it ensures high-impact publications and insights that can have a ripple effect through science and education for decades to come. For governments, industry and the community, such discoveries can lead to great economic and social outcomes.

How do researchers get to run experiments at central facilities?

Many facilities operate a user program; the “users” are often researchers based at universities or government agencies, visiting the facility for a few days or weeks to perform experiments that further their research. While at the facility they work with a second group of researchers and technical crew, employed by the facility to run the scientific instruments. The users and inhouse researchers collaborate to run experiments and publish the results from experiments as co-authors.

How can Dimensions be used to evaluate user facilities?  

Dimensions is the world’s largest database of research information, including individual researchers and their institutions, their research grants, publications, datasets, patents – even clinical trials as a linked dataset. Using Dimensions, it’s possible to delve into the connections between researchers, including those working at central research facilities.

Here we explore the collaboration patterns of users and in-house researchers at ISIS Neutron and Muon Source in the UK. At ISIS, beams of neutrons or muons are used to study materials at the atomic scale – from cracks in wind turbine blades to the structures of viruses and the inner workings of lithium batteries.  

We’ve made this example a bit harder for ourselves because ISIS is not currently indexed in Dimensions as a research organisation; instead, inhouse scientists are shown to be affiliated to the Rutherford Appleton Laboratory (RAL) where ISIS is based. Therefore, to find articles that include experimental results from ISIS, we can devise a search string within Dimensions that returns articles mentioning ISIS in the full text. This search string will, for example, look into each article’s methods sections, in which co-authors will indicate that data was collected at ISIS. Sounds complex? Not really, because the information available to Dimensions is so deep that we’re able to conduct this search with relative ease.

Who gets to use these facilities, and how can Dimensions help?

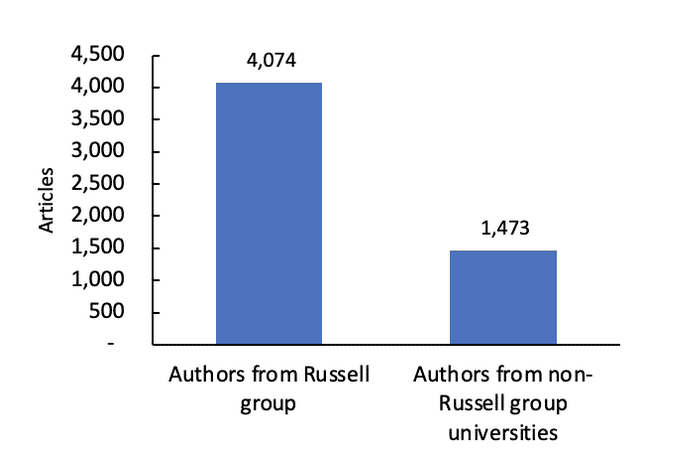
Comparative analyses are always useful. Here (Figure 1) we’ve conducted an analysis that compares the use of ISIS Neutron and Muon Source by researchers at the 24 leading Russell Group universities (effectively the UK’s “Ivy League”) with all other non-Russell Group universities. We can see which institution’s researchers get to use ISIS by comparing the number of articles that mention that facility.

Figure 1: Number of articles that mention ISIS, authored by researchers from Russell Group universities versus non-Russell Group universities.Source: Dimensions.

We see that Russell Group researchers are nearly three times more likely to be co-authors on publications mentioning ISIS than a non-Russell Group researcher.

Such an analysis could be used to identify opportunities to widen the user base of central facilities, ensuring that all eligible researchers – regardless of their home institution, country or research focus – have the opportunity to run experiments at those facilities.

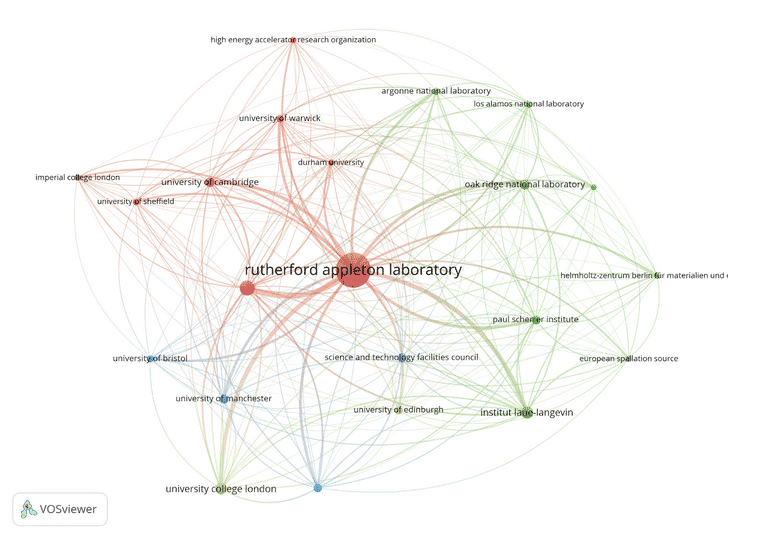
Figure 2: Collaboration networks of publications that mention ISIS. Organisation (nodes) linked by co-authored articles that mention ISIS (lines with thickness proportional to number of articles). Source: Dimensions, using VOSviewer.

In this network diagram (Figure 2) we see which research organisations are collaborating with ISIS. Co-authorship is used as a proxy for collaboration; if researchers from two different organisations have co-authored an article, then that is considered a collaboration between their two organisations.

As we might expect, articles that mention ISIS are most often co-authored by teams of researchers from RAL and UK universities, usually Russell Group. However, this network diagram reveals a second set of collaborations between inhouse researchers at ISIS affiliated to RAL and researchers at other neutron facilities across Europe and the US.

Similar analyses could be prepared showing collaborations between individual users, disciplines or countries. Dimensions’ full-text search means that analysis could also focus on a whole national laboratory site, such as RAL or Argonne National Laboratory, a single machine, or facility.

What else can Dimensions show?

There are a host of questions that Dimensions can support governments and funders in answering, including:

  • Which research areas or emerging technologies are facility experiments contributing to?
    Value: to anticipate the current and future needs of the research community and inform beamline commissioning and future strategy.
  • Comparing facilities – do existing or future infrastructure plans copy, compete or complement similar facilities? Are there existing collaborations or opportunities to foster new collaborations?
    Value: to avoid duplication and needless expense and maximise strategic expenditure.
  • Do participants of facilities’ training programs become facility users?
    Value: to see where training and professional development programs are demonstrating the most effectiveness, leading to return on investment.
  • Find experiment proposal reviewers with relevant expertise.
    Value: identifying cross-collaboration opportunities and widening the pool of facility users.
  • Are funding agency award holders using facilities?
    Value: identifying appropriate use of public expenditure and return on investment.

About Dimensions

Part of Digital Science, Dimensions is a modern, innovative, linked research data infrastructure and tool, re-imagining discovery and access to research: grants, publications, citations, clinical trials, patents and policy documents in one place. www.dimensions.ai 

Talk with our team about how Dimensions can support your research.

Alex Sinclair

About the Author

Alex Sinclair is a Senior Analyst in the Dimensions Government and Funder team.

The post How can central research facilities expand their role in the science community? appeared first on Digital Science.


from Digital Science https://ift.tt/J8lt7dP

Tuesday, July 19, 2022

Inspiring dreams: the new James Webb Space Telescope

“Cosmic Cliffs” in the Carina Nebula, approximately 7,600 light-years away from Earth. Image taken by the James Webb Space Telescope (JWST).
Image credit: NASA, ESA, CSA, and STScI.

As children we look up to the beauty of the night sky and are inspired to dream. I recall as a small child being fascinated by my father’s books on astronomy and the beautiful pictures of now-familiar starscapes such as the Horsehead Nebula. That led me to join the astronomy club at school and spending nights in the cold, sleeping on the floor of the cricket pavilion, and waking up at the right time with other similarly nerdy teens, to peer up through a telescope lens to see if we could locate the moons of Jupiter. How many of today’s scientists (not just astronomers) are doing what they do in part due to some similar formative experience? A wonder about the universe and a desire to understand its mysteries.

A whole new generation of scientists may now have been inspired to dream and perhaps, one day, will pursue a career in research. The James Webb Space Telescope (JWST), launched at the end of last year, released its first images a week ago. While one does not need to be a scientist to find these shots breathtaking, it is humbling to think that we live in an age where “big science” events like this don’t just happen once in a lifetime, but every few years. Indeed, the pace of discovery is accelerating, powered by the engineering and technology that globally both the public and private research ecosystem is building.

It is said that familiarity breeds contempt, and perhaps a justifiable fear that the regularity of such advances may lead to a lack of anticipation or excitement, as happened with the US space program in the 1970s. But, as we will see below, at least in the global science community, JWST is already set to loom large in our collective psyches for some years to come and bring huge value to our lives in so many ways, as Professor Monica Grady from the Open University has so eloquently set out.

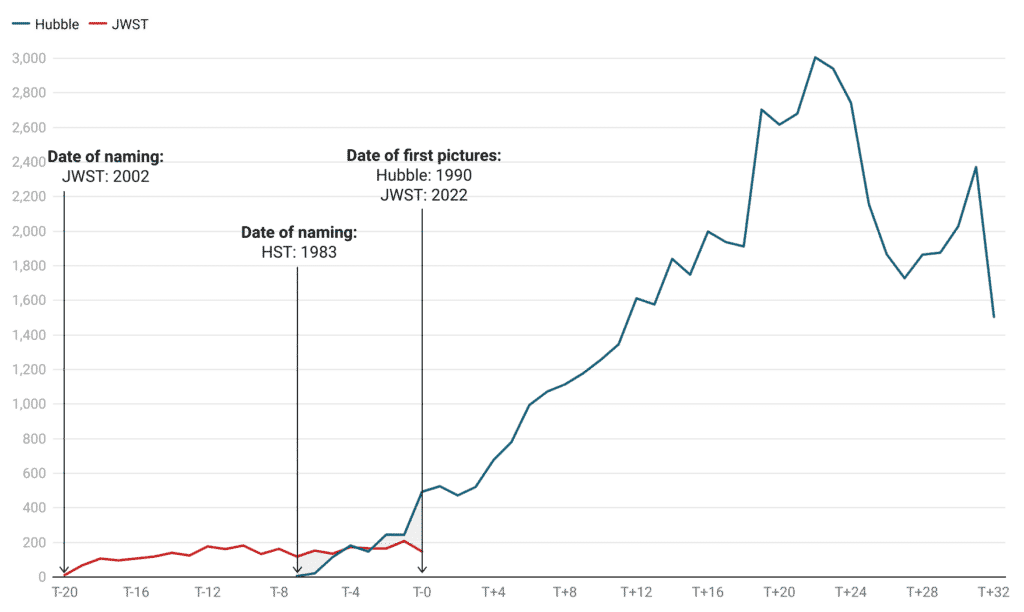
The idea of going beyond our atmosphere to look at the stars was first suggested by American theoretical physicist Lyman Spitzer in 1946. His ideas led to a number of orbital observatories – the American Orbiting Astronomical Observatory OAO-2 in 1968, the Soviet Orion 1 in 1971. This lineage eventually led to the most famous space telescope to date, Hubble. And it is Hubble that we want to use as a benchmark to compare the attention associated with JWST.

Riding off the back of the success of the moon landing, NASA put forward a paper in 1969 on the uses of a large space telescope, but it was not until 1977 that the ambitious project was funded. Six years later in 1983 the name Hubble was given to the project. While the terrible Challenger disaster of 1986 must have caused significant internal challenges at NASA, the project pressed on and Hubble was launched in 1990, with the first scientific paper being submitted on 1st October 1990.

In the subsequent 32 years, even with initial teething trouble, Hubble has not only gone on to profoundly advance our understanding of the universe in which we live – from helping to establish the existence of black holes, to detecting water vapour on Europa (one of those moons of Jupiter that I was searching for all those years ago) – but has also served as a platform for us to understand how to engineer devices that live in the vacuum of space.

When Hubble first returned results in 1990, I recall the media attention being massive. My perception is that this is similar today but when I looked at Dimensions, I was shocked to see that there were already almost 15,000 papers citing the JWST! I couldn’t help but wonder if JWST is already more famous than Hubble.

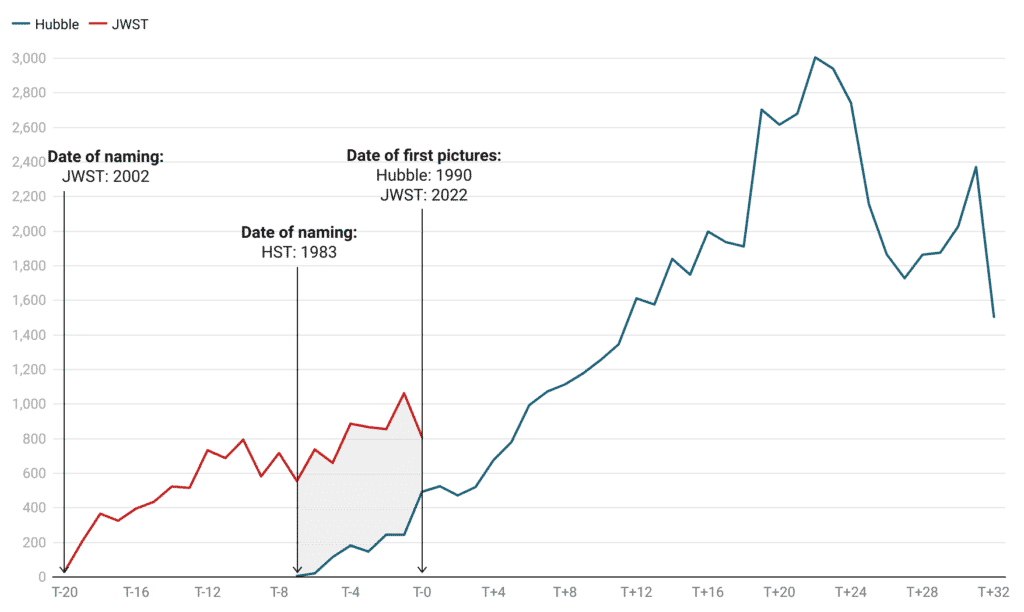
Figure 1: Scholarly mentions of Hubble versus JWST from Dimensions placed on a reference timeline zeroed to their first pictures. “T-0” is 1990 for Hubble and 2022 for JWST. Note that the name for JWST was announced around 20 years before the first pictures were released whereas Hubble was named just seven years prior to its first pictures being shared. Source: Dimensions.

It seems, at first glance, that the JWST is receiving significantly more attention than Hubble at the same point in its existence. One might speculate as to the reasons for this – perhaps being named relatively further in advance of launch than Hubble, or the controversy over the choice of name might have increased the attention to the telescope. However, the growth of research over the intervening years is not negligible (indeed, Hubble has played an important role in the growth in astronomical and space science).

The area of Astronomy and Space Science (ANZSRC FoR 0201) has grown significantly in the last 30 years and much of that growth comes from the advances made possible by Hubble itself. Using the ANZSRC FoR (Field of Research) definition of the field, Dimensions suggests that there were around 6,600 papers, conference proceedings, pre-prints, monographs and edited books produced in the 1983, whereas in 2021, there were around 33,600 such outputs – a five-fold increase. (Book chapters are specifically removed from all the analyses here to remove peaks from astronomical encyclopaedia publications that skew specific years.)

Figure 2: Scholarly attention to HST and JWST in the academic literature – as in Figure 1, but with JWST mentions normalised based on factoring the growth in the field of Astronomy. Source: Dimensions.

Figure 2 shows the result of a simple approach to rebase the JWST attention, to account for the difference in time periods during which the attention was received. In this case, we looked at the growth in Astrophysics using the ANZSRC FoR Code definition of 0201 Astronomical and Space Science to create an inflation rate for the field from 1983 (T-20) to present day. We then divided the JWST output number by the compound inflation rate year on year for each year from T-7 up to T-0.

Normalisation, however, must be taken with real care. There is one further edge effect that means that we cannot trust the T-0 JWST line. Since 2022 (T-0 for the red line) is the current year, it is incomplete and hence cannot be compared to a full year. You can see the same effect in the dip in T+32 (2022 for the blue Hubble line). Thus, while 2022 looks to be a disappointing year for JWST, it is because the comparison is between a partial year with a full year. This will, I’m sure, be an amazing year for JWST publications, which are set for lift off in the coming years, if the example set by Hubble is followed.

Subjectively, it is often easy to recall the golden days of the past and how wonderful things were. However, in this case, we can see that the level of excitement, as measured through research publications, of the JWST compared with the launch of the Hubble is entirely comparable. Not only this, thanks to Hubble this excitement has been sustained over the last 20 years.

We at Digital Science wish the JWST team at NASA and around the world the very best for their coming data releases. This is the stuff of which dreams, and future scientists, are made.

About Dimensions

Part of Digital Science, Dimensions is a modern, innovative, linked research data infrastructure and tool, re-imagining discovery and access to research: grants, publications, citations, clinical trials, patents and policy documents in one place. www.dimensions.ai 

Daniel Hook

About the Author

Daniel Hook, CEO | Digital Science

Daniel Hook is CEO of Digital Science, co-founder of Symplectic, a research information management provider, and of the Research on Research Institute (RoRI). A theoretical physicist by training, he continues to do research in his spare time, with visiting positions at Imperial College London and Washington University in St Louis.

The post Inspiring dreams: the new James Webb Space Telescope appeared first on Digital Science.


from Digital Science https://ift.tt/QxhpFbM

Tbilisi State University Achieves Global Recognition for Research Excellence

Tbilisi State University Achieves Global Recognition for Research Excellence Tbilisi State University (TSU) has been highlighted for its s...